
Understanding product life cycles influences your buying decisions because it reveals the environmental cost behind every device. For example, your laptop already had an environmental footprint before you opened the box, and that impact continues through disposal.
Yet, when it’s time to buy, most of us judge technology by price, screen size, and battery life. None of that says anything about the mining and shipping behind it. At Eco4TheWorld, we think that missing piece explains why good buying intentions fall flat at the checkout.
To help you look beyond those details, this guide shows how assessments measure hidden costs and how to compare two devices fairly. You’ll also learn how your choices influence what brands produce.
Let’s get into it.
What Does a Product Life Cycle Assessment Reveal About the Technology We Buy?
A product life cycle assessment reveals the full environmental cost of a device, including raw material extraction, manufacturing, use, and disposal. Also called a life cycle assessment, or LCA, it tracks the resources used and waste produced across the product’s life cycle.
The next three sections explain how the assessment works, starting with the device’s life cycle stages.
The Four Life Cycle Stages of a Device
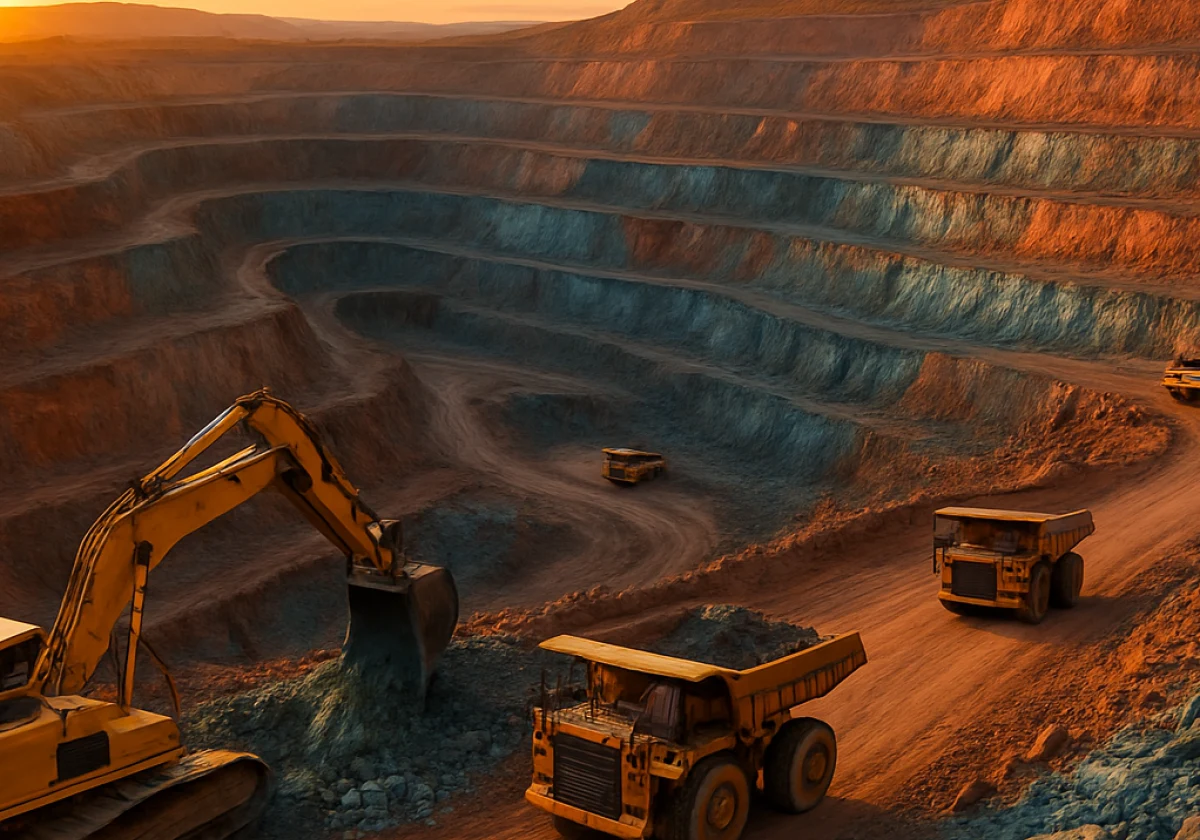
Every device moves through four life cycle stages: raw material extraction, manufacturing, use, and end of life. The process begins with mining, which extracts cobalt, lithium, and copper from the ground and can cause serious environmental damage.
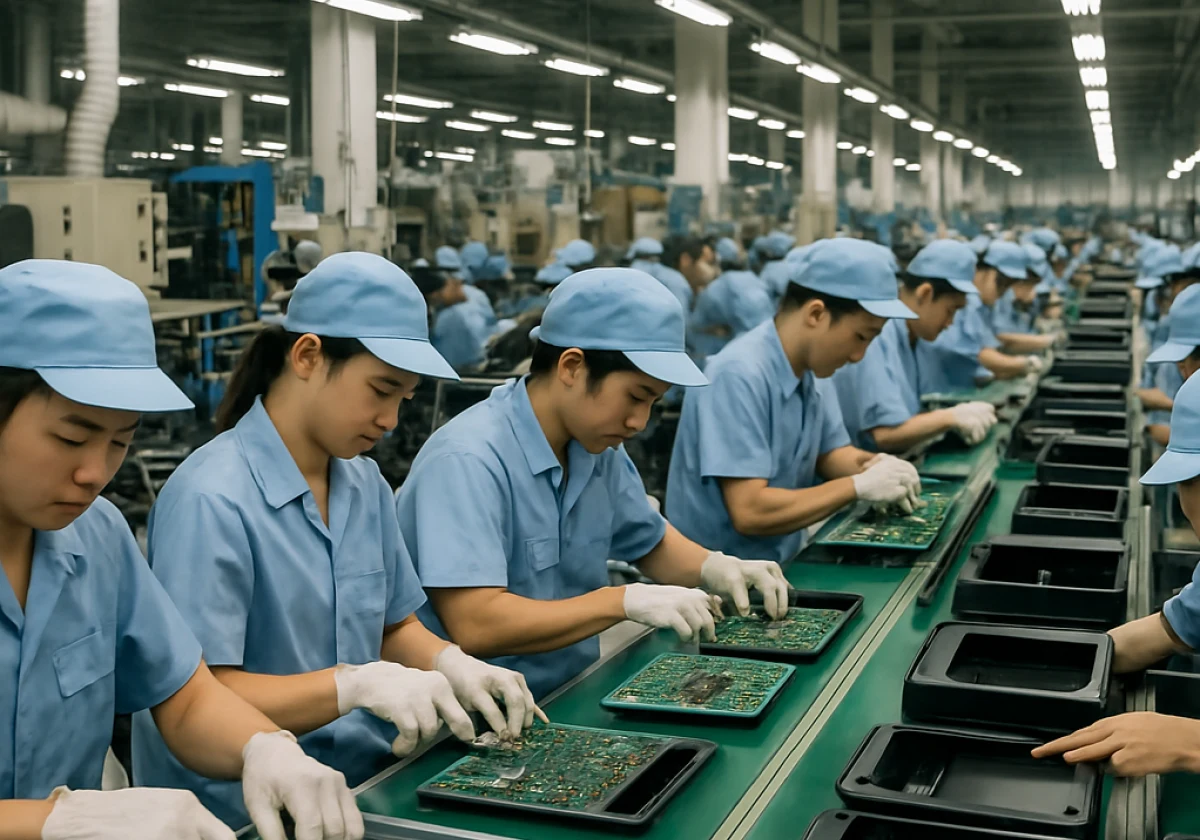
Next, manufacturers use those materials to produce chips and casings. The process draws electricity from power grids in other countries (and plenty of those grids still burn coal).
Once the device reaches your hands, daily charging adds to its environmental footprint. Eventually, its parts may be recycled or end up in landfill. Recycling remains limited, though.
According to the Global E-waste Monitor, the world generated 62 million tonnes of e-waste in 2022, but formally collected and recycled only 22.3%.
Setting the Scope: Factory Gate or Cradle to Grave?
Every assessment begins with goal and scope definition, which sets the functional unit and system boundaries. For example, one study might stop at the factory gate, while another covers the device’s entire life cycle.
That difference can explain why two reports on the same laptop show very different results. Check the scope first (the boundaries determine what the figures include).
Why Inventory Analysis Collects So Much Data
Inventory analysis tracks energy, water, and waste across the supply chain. To gather these figures, teams collect data directly from suppliers and use database averages when details are missing.
However, getting accurate supplier data takes time. The quality of that data then determines how reliable the final assessment is.
Life Cycle Impact Assessment and Interpretation: Where the Numbers Make Sense

Two phones with nearly identical specs can have very different carbon footprints. To compare their environmental impact, life cycle impact assessment groups data by carbon emissions, resource use, and water use. This makes the figures easier for buyers to understand and compare.
Interpretation then shows which stage harms the environment most. For phones, manufacturing often causes the most emissions, while desktops may produce more during daily use. Environmental product declarations show these differences, and ISO 14040 provides a common way to measure them.
Because of this, a product carbon footprint (PCF) on a spec sheet only helps if you know what it covers. For example, one brand may include shipping costs in its carbon figures while another leaves them out. Such differences can change the comparison (the cheaper laptop isn’t always the cleaner one).
Our advice is simple: Trust devices with clear environmental data over those with only green labels. This helps you avoid paying extra for marketing instead of a smaller environmental footprint.
Comparing Two Laptops Side by Side for Sustainable Technology Choices
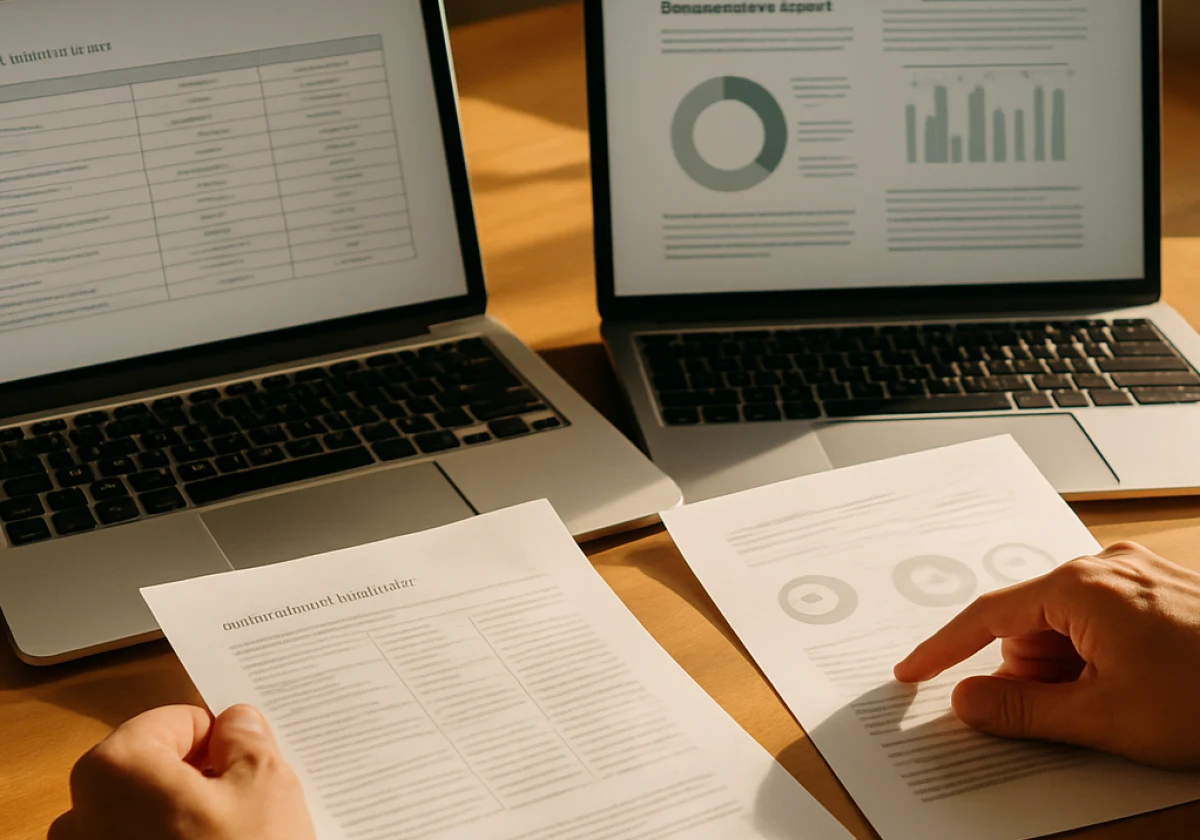
Side-by-side data helps you choose a laptop with a smaller environmental footprint. Even two laptops with the same processor can have very different impacts.
To see how they compare, the table below shows four measures to check before choosing either one.
| Measure | Laptop A | Laptop B |
|---|---|---|
| Manufacturing emissions | 220 kg CO2e | 310 kg CO2e |
| Use phase over four years | 95 kg CO2e | 70 kg CO2e |
| Recycled aluminium in casing | 75% | 20% |
| Repairability score | 8.5 out of 10 | 4 out of 10 |
| Total across the entire life cycle | 315 kg CO2e | 380 kg CO2e |
The figures give you a starting point, but repairability deserves attention too. If two laptops have similar emissions, choose the one that’s easier to repair. A longer lifespan means fewer replacements and less waste.
Consumer Awareness Is Changing What Green Technology Brands Build
Your buying choices can also influence how brands design their products. As more buyers look for greener technology, companies pay attention to their needs and buying habits.
Over time, these choices encourage brands to improve their products in three main ways.
- Longer Repair Windows: Several major phone brands now offer spare parts for seven years after launch, so people can repair their phones instead of replacing them. Repair cafés in Melbourne and Brisbane also help people keep their devices working longer.
- Published Footprint Data: As buyers ask for more details, brands share environmental impact data for individual products. You can use these figures to compare devices before buying.
- Modular Product Design: Replacing a battery or screen without removing glue helps devices last longer and allows parts to be reused. To make repairs easier, some brands now plan for them early in the design process.
All three changes reflect a growing focus on longer-lasting devices and clearer environmental information. Ask about parts, data, and repairs, and you can influence what brands offer in the future.
Buy With the Entire Life Cycle in Mind
A lower price doesn’t always mean a smaller environmental impact. Before buying, check the device’s life cycle assessment for manufacturing emissions, energy use, and disposal details. These figures can help you compare its environmental cost with other options.
For your next purchase, ask the brand for its environmental data before comparing prices. While you’re at it, check the repair options and spare parts to see how long the device could last.
Ready to buy with the whole picture in front of you? Explore Eco4TheWorld for practical guidance on sustainable technology choices that support long-term use.